
In the second instalment of our carbon roadmap series, we emphasise the importance of understanding your current situation, and how this enables effective decision-making.
Craig Needham and James Ashley share insights from our materiality assessment, showing why data is central to the success of a carbon vision in Real Estate. We look at how this data can be applied to generate actionable insight, using our carbon emissions calculations, and greenhouse gas inventory.
With our guidance, you’ll be able to identify immediate carbon reduction opportunities for your asset or portfolio.
Stage 2 - Understand your current situation to enable effective decision-making
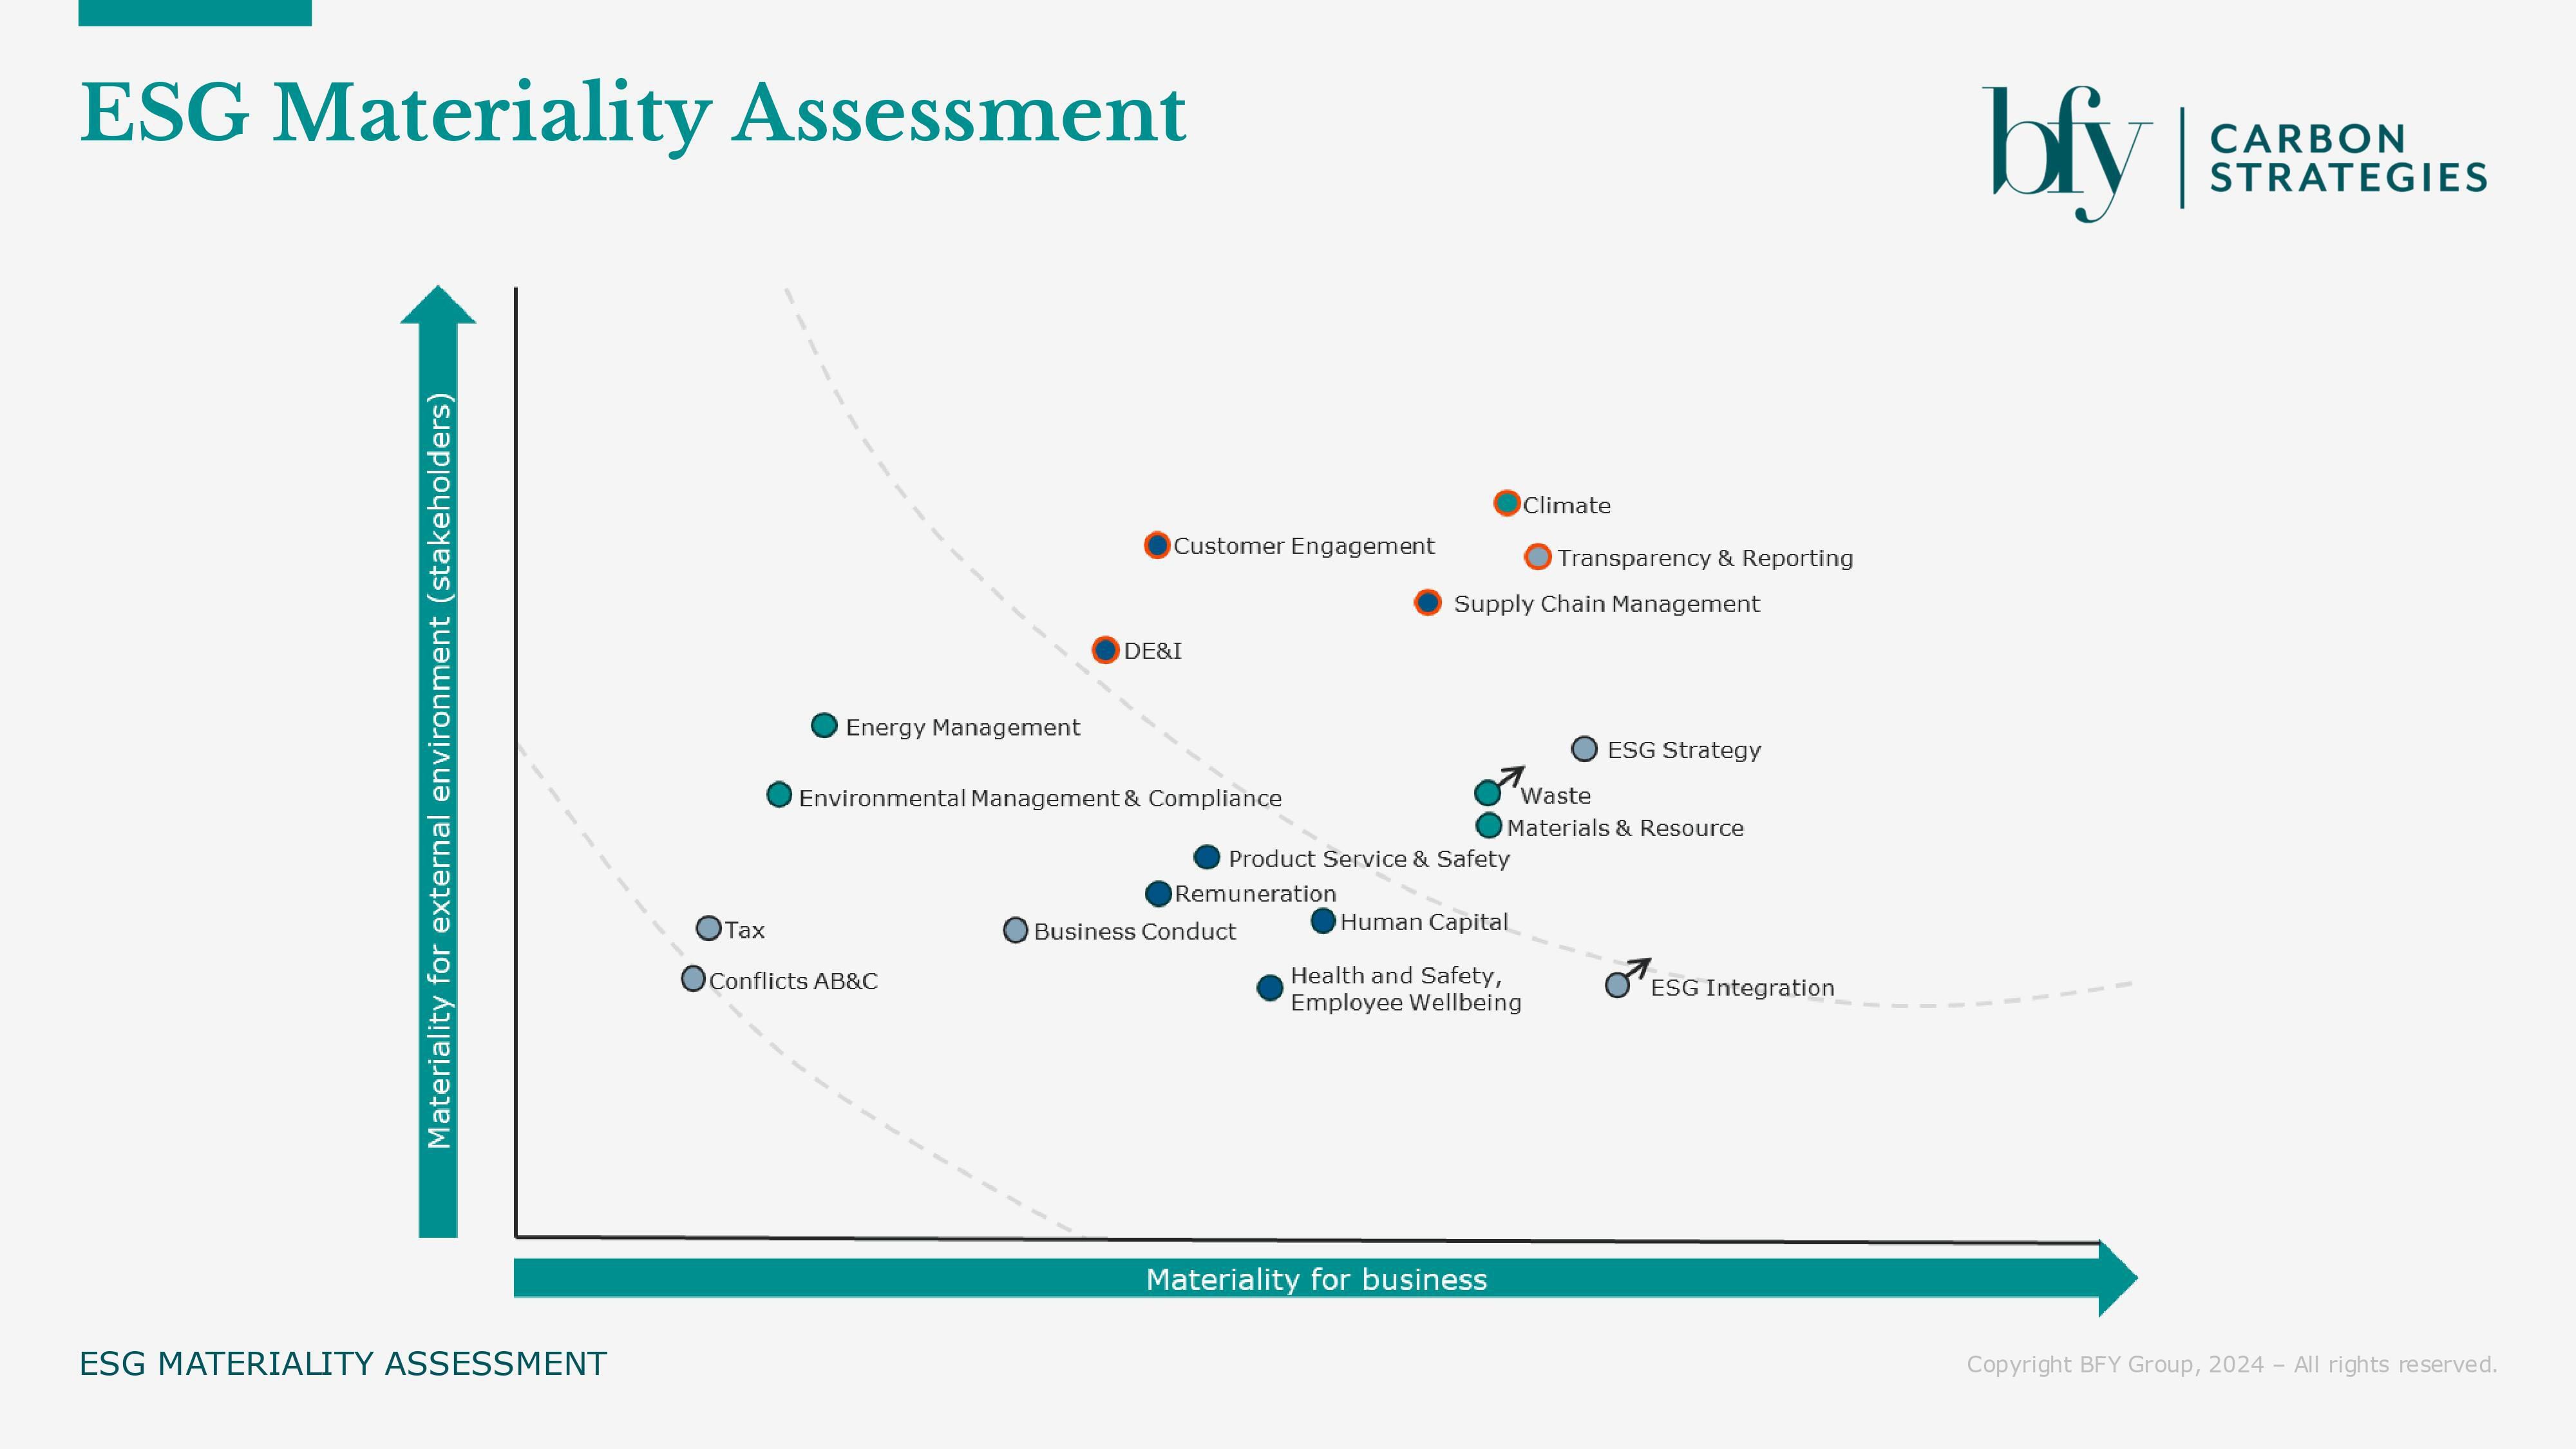
Complete a materiality analysis
Materiality is unique to every business. A successful carbon reduction roadmap starts with an identification of the environmental challenges facing your organisation. Examples of what to include in a carbon reduction materiality analysis are:
- Climate Change mitigation
- Air pollution
- Material and Resource efficiency
- Supply chain management
- Biodiversity
- Waste management
- Social engagement
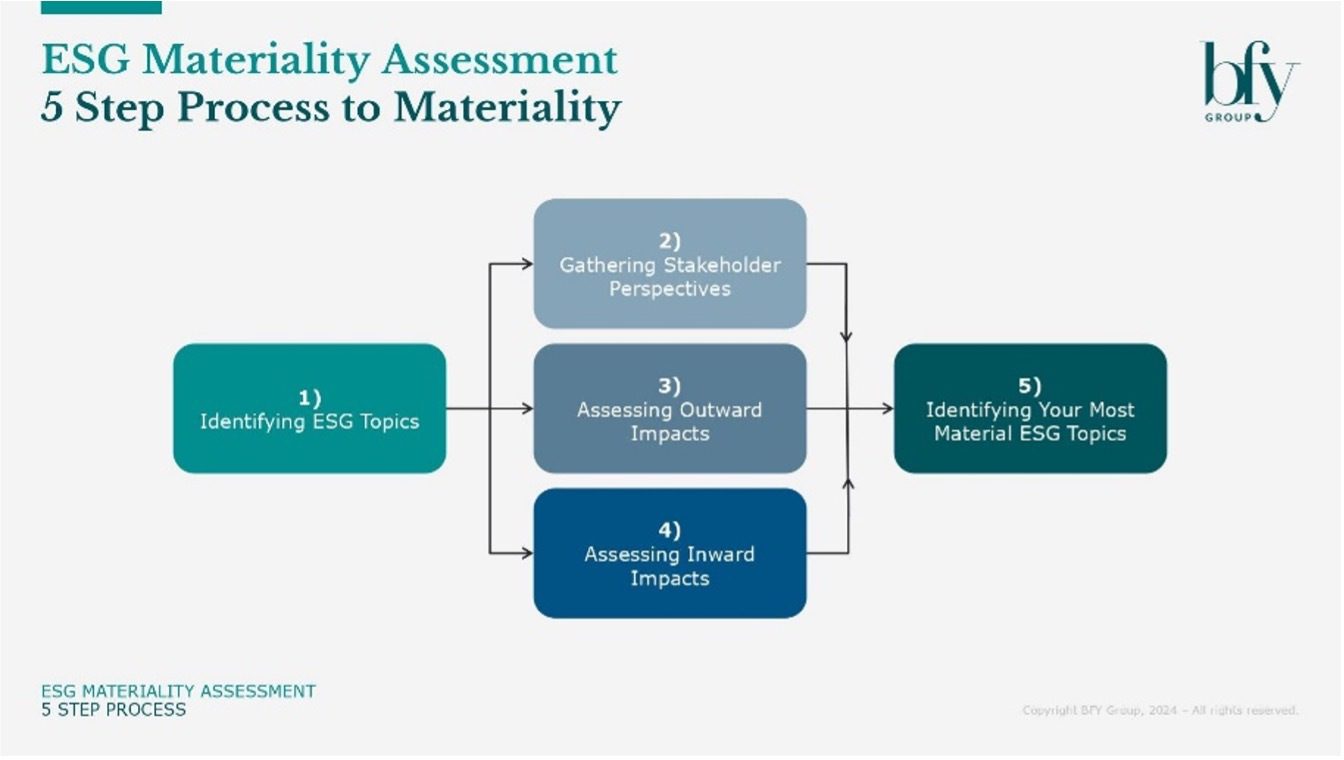
Our 5-step process to Materiality outlines the process to be followed with stakeholder perspectives, outward impact (effects the company has on externalities) and inward impact (effects on the company from external sources).
By completing this effectively, companies can side-step ad-hoc decision making, and make strategic choices about how to change. When clearly aligned with vision this can make a powerful impact.
Furthermore, materiality analysis informs investment decision-making and enables businesses to achieve the benefits of their carbon reduction plan. Evidence shows that investment in material sustainability issues boosts firm financial performance vs. non-material sustainability issues, to the amount of 3%-5% annualised return. On this data, the conclusion is that it’s most important to understand your challenge and opportunity areas, making considered investments, rather than ‘gut-feel’ decisions.
Turning detailed data into valuable insight
Alongside identifying material challenges, up-to-date and high-quality carbon emissions data is essential to drive a meaningful reduction.
To complete the carbon emissions calculation, the Greenhouse Gas Protocol (GHG protocol) has become the leading standard for global emissions reporting, and provides comprehensive guidance.
Within the GHG protocol, there are three main categories for emissions:
Scope 1: Company direct emissions
Scope 2: Indirect emissions from purchase of electricity/energy
Scope 3: Indirect emissions, covering those produced by customers using products or emissions within the supply chain
Scope 1 and 2 emissions are normally within direct control, or influence, of a company, and therefore simpler to measure and make change, whereas Scope 3 emissions are under the control of suppliers or customers, and are therefore affected by decisions outside the company’s control. Examples of scope 3 emissions are:
- Purchased goods and services
- Waste generated in operations
- Business travel
- Downstream transportation and distribution
- End-of-life treatment of sold products
- Investments
Resultantly, this means scope 3 emissions are often the most significant, but the hardest to tackle and involves tracking activities across the entire value chain – from suppliers to end-users.
This is why clarity of vision is so important in maintaining the motivation to overcome the ‘hard-yards’ of creating an inventory of carbon emission sources, gathering the necessary data and calculating the emissions.
Further incentive should also be provided in the theme of risk mitigation, as addressing scope 3 emissions can prevent backlash in the areas of reputation, supply chain reliability, and regulatory risk. It also presents opportunities to reduce cost, drive innovation, and increase sales.
At BFY Carbon Strategies, we’re experts in identifying emission sources and calculating carbon impact for scope 1,2 & 3 emissions. Below, we’ve summarised our approach which is based on GHG protocol guidance.
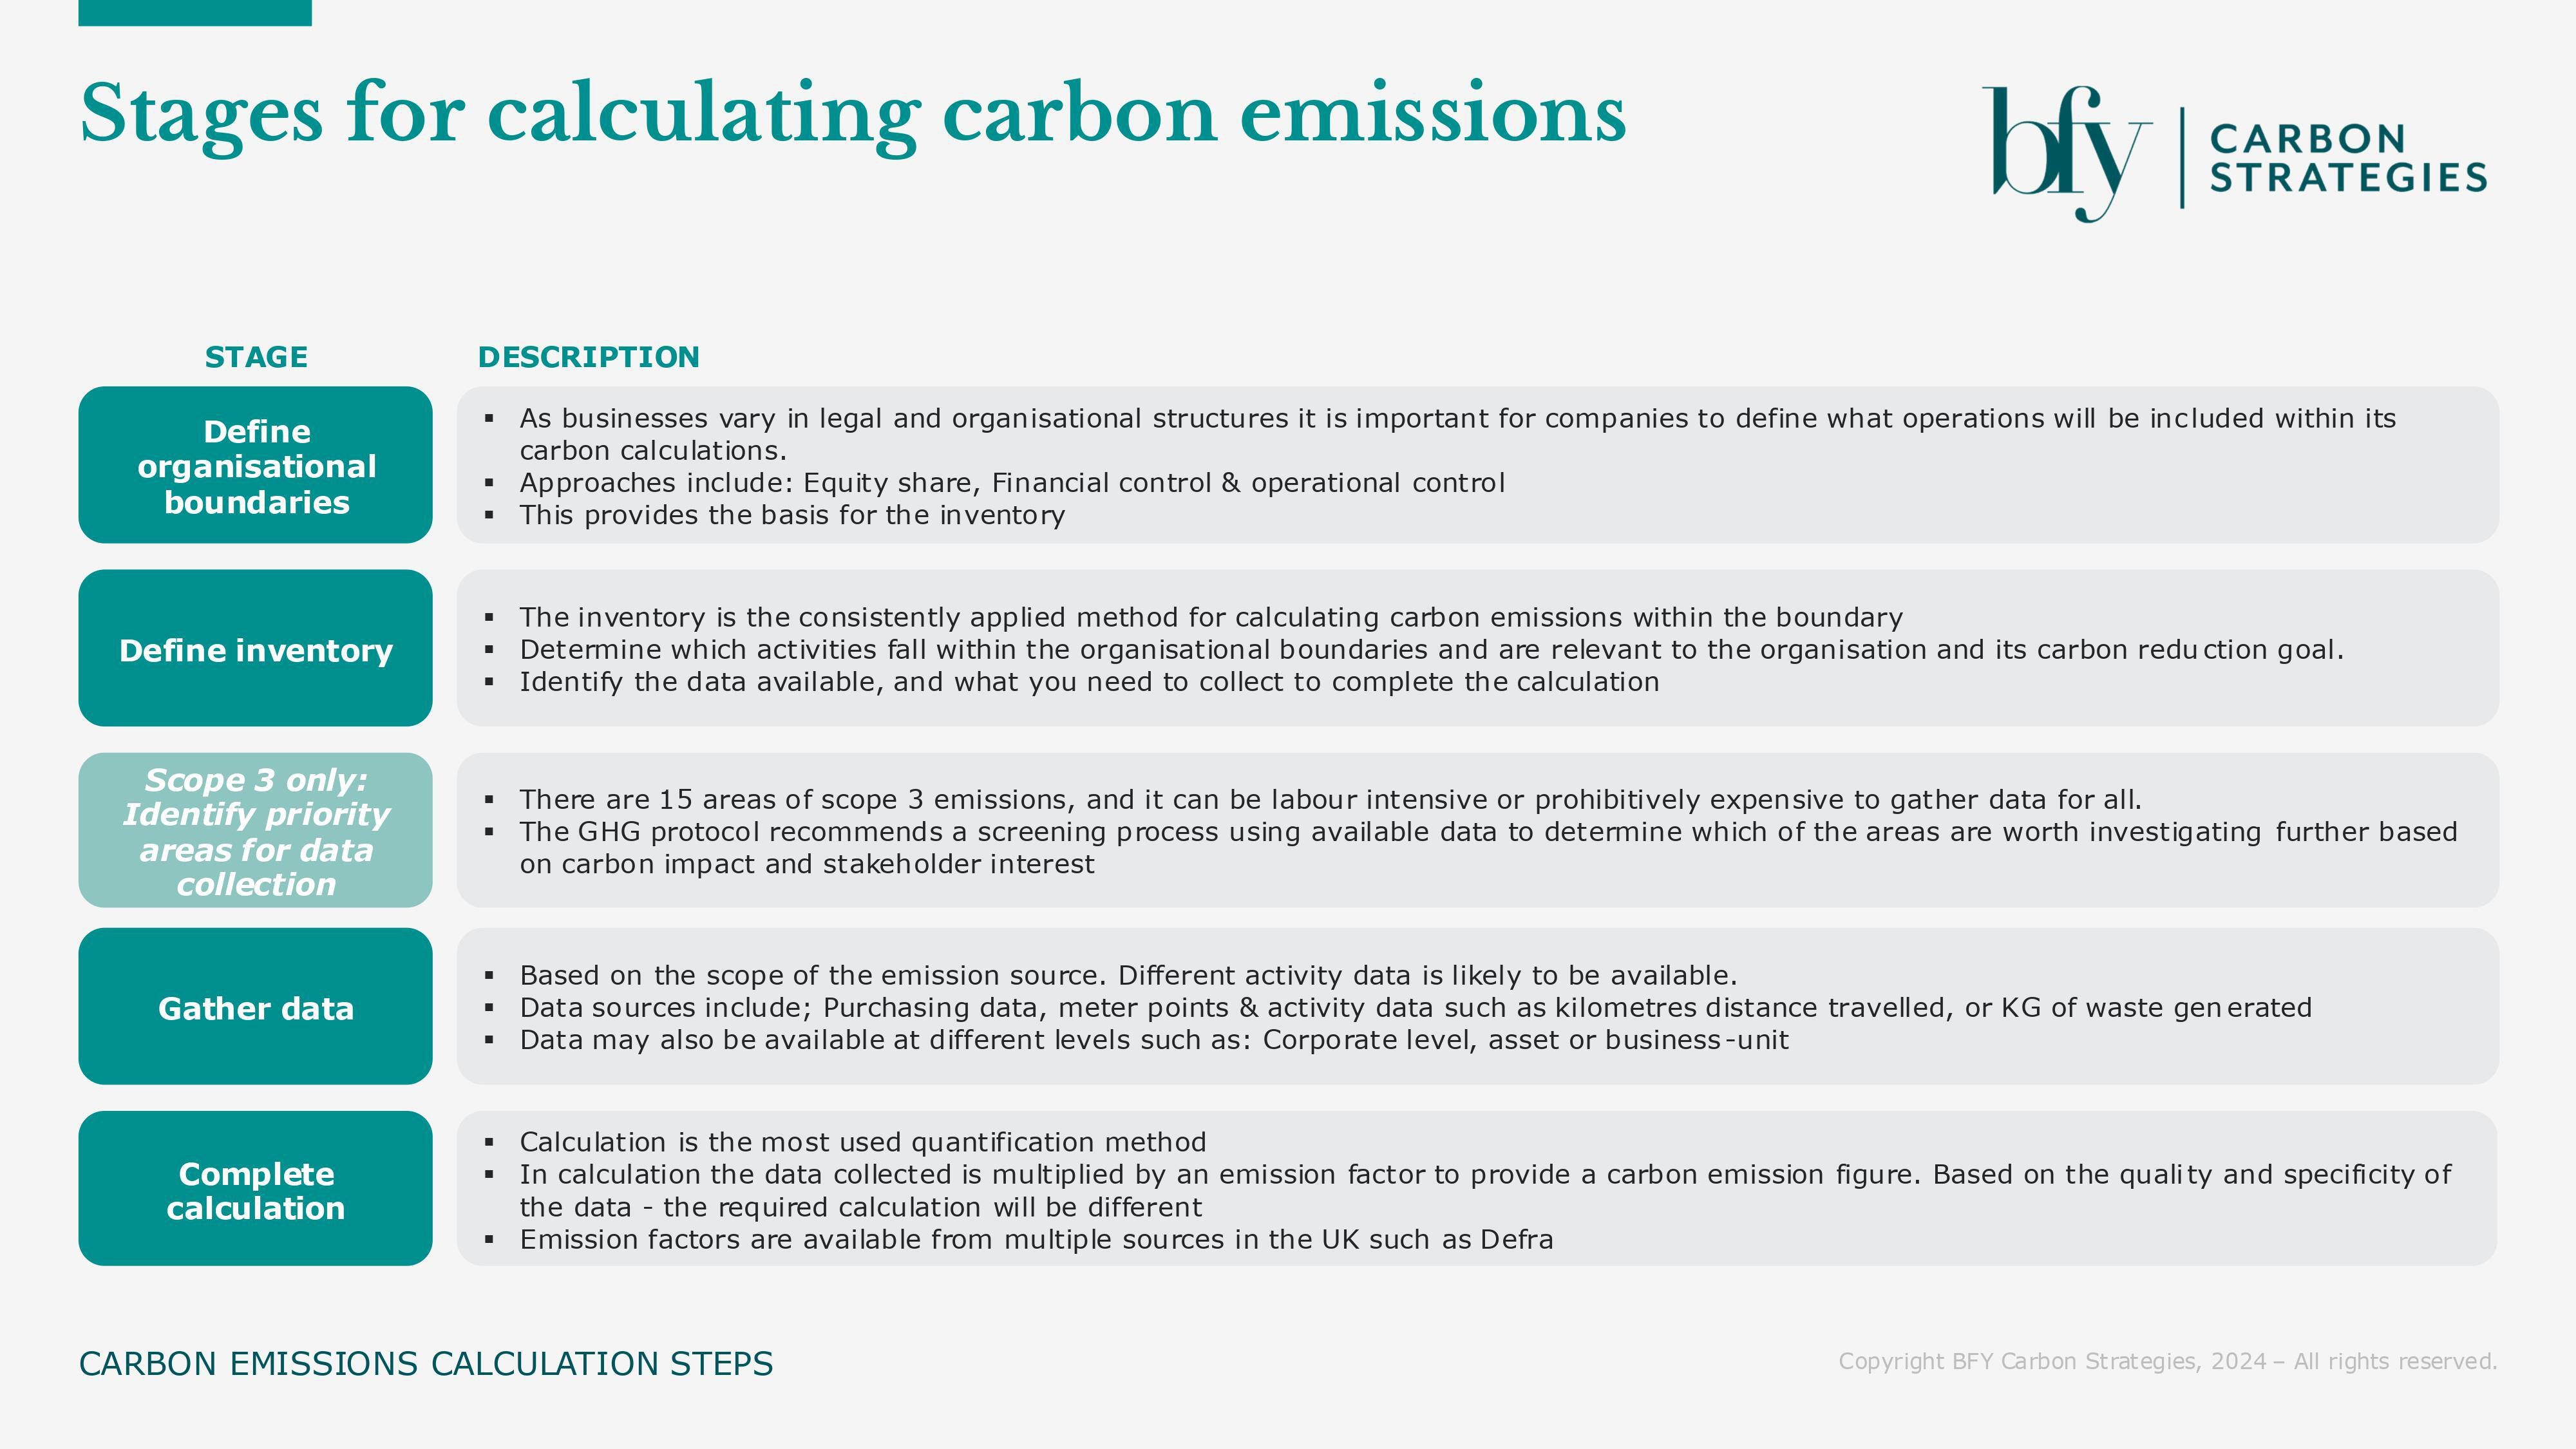
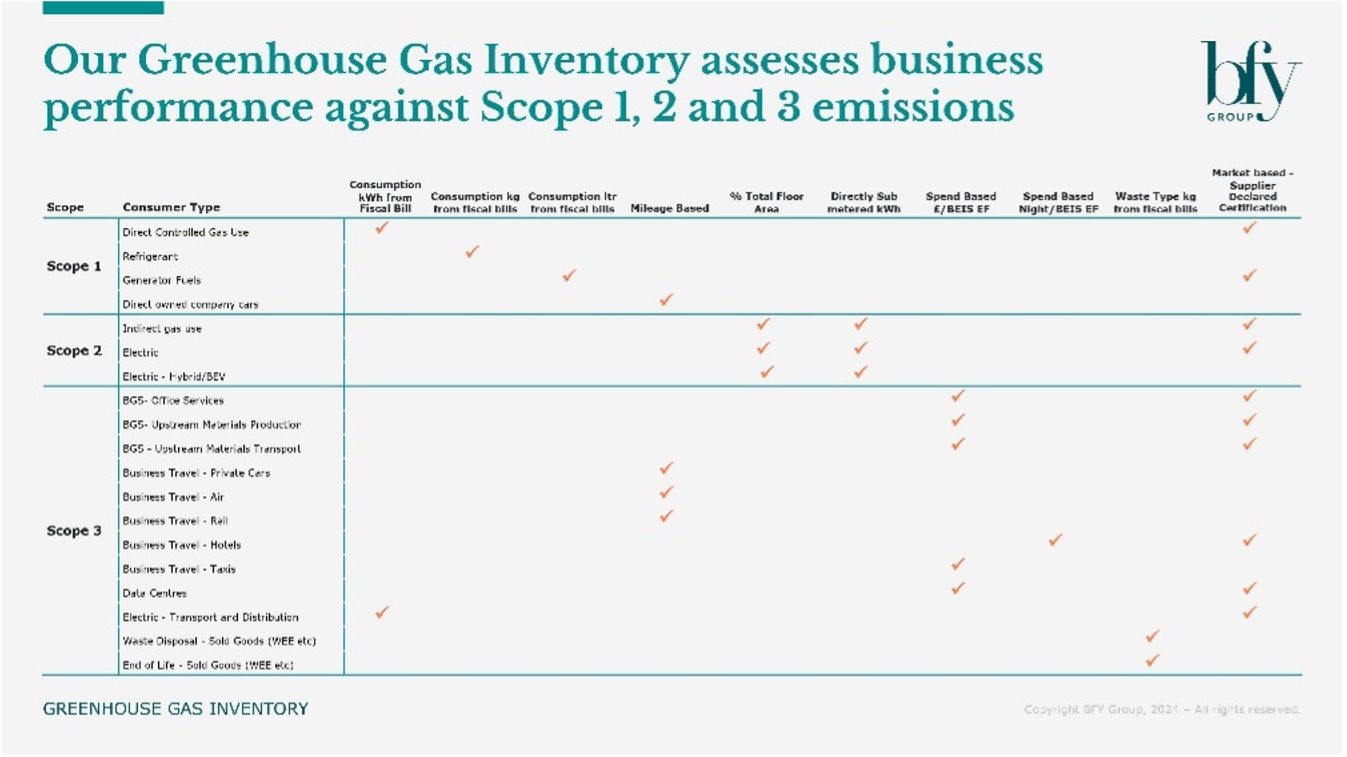
Our inventory and calculation enables a scope 1,2 and 3 output which is succinctly summarised for organisational leaders and board level meetings - turning detailed data into valuable insight. An example is provided here:
Identifying performance gaps, and hotspots for carbon reduction
Based on the results of your carbon emissions calculation and materiality analysis, you can then make informed decisions on how to create a carbon reduction roadmap.
This is based on the identification of hotspots, which are considered as the areas with the most significant impact or potential, and which present the opportunity to prioritise actions and make changes to reduce carbon emissions. This is often summarised as a selection of ‘performance gaps’.
Performance gaps are an identification of real-time immediate opportunities. They can be quantified by evaluating the carbon performance data against the benchmark of your industry, or the expectations of stakeholders as considered in the materiality analysis.
Understanding the gap and associated opportunity is a further ‘change trigger’, which when framed as an economic opportunity, can catalyse action in an organisation.
Applying these approaches with our clients, we’ve unlocked opportunities for savings as high as £100m, as shown here with a FTSE-100 global insurance business.
If you’re curious about carbon reduction opportunities for your asset or portfolio, and how material, data-driven improvements can be realised, contact Craig Needham.
Click here for the final instalment of our carbon roadmap series – Delivering your carbon roadmap through decisive action.